The Algorithmic Future of Solar Finance
Predictive revenue forecasting and bank-grade risk management (VaR/EaR) for utility-scale solar assets above 5 MW. Protect your cash-flow from negative prices, market volatility, and cannibalization.

The Reality of Modern Solar Production
Why traditional cash-flow models fail in volatile power markets
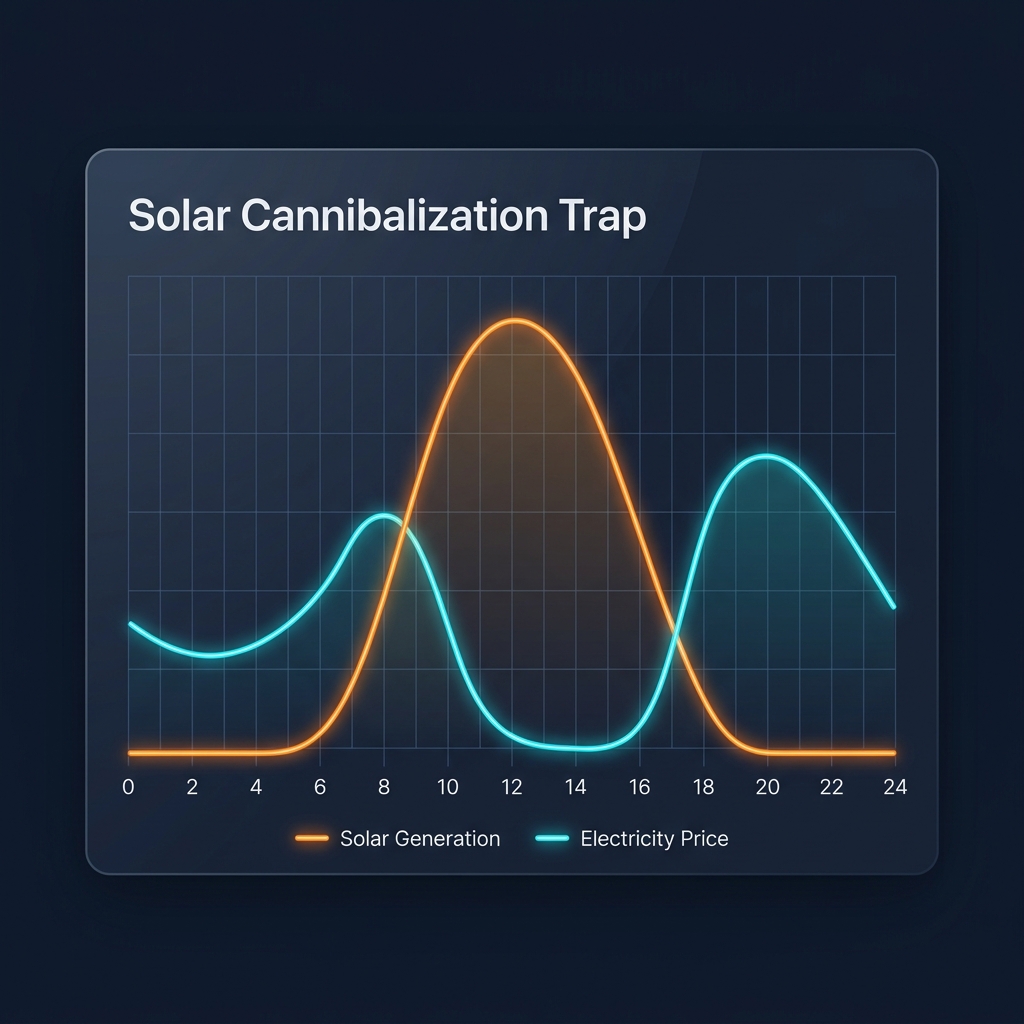
The Cannibalization Trap
When weather is perfect, every solar plant generates at peak capacity. This floods the grid, causing Day-Ahead spot prices to plummet to zero or negative values exactly when your production is highest.
-
01
High Irradiance
Solar assets generate peak capacity during midday hours when solar irradiance is strongest.
-
02
Market Flooding
Simultaneous generation from all regional solar assets floods the transmission grid with excess supply.
-
03
Price Cannibalization
Day-Ahead spot prices plummet to zero or negative values exactly when your production is at its peak, eroding merchant revenue.
Intraday Balancing Imbalance
Sudden cloud coverage creates massive deviation penalties from your schedules. Without direct TSO coordination or portfolio mixing, single assets are exposed to severe cash penalties.
Outdated Retrospective Reports
Traditional accounting reviews past numbers 60 days late. In a market shaped by algorithmic power trading, you cannot manage risk by looking backwards. You need a forward-looking predictive strategy.
The Two-Part Mathematical Engine
Bridging physical weather reality with complex energy exchange trading rules
Market Simulator (Monte Carlo)
PhotonRisk generates 10,000+ daily scenarios for any Day-Ahead market, modeling extreme price spikes, negative price hours, seasonal patterns, and weekend price suppressions.
- 20-30 years of geo-localized weather data
- Forecasted solar grid penetration scenarios
- Forward exchange curves & historical spot volatility
Contractual Reality (Contract Engine)
We convert raw market price simulations into actual cash in your pocket by overlaying exact aggregator contracts, fees, discount structures, and risk thresholds.
- Asymmetric curtailment logic (inverter shutdown)
- Aggregator haircuts & fixed/variable fee structures
- Merchant vs. Power Purchase Agreement (PPA) allocations
Executive Risk Dashboard
Decision support based on 4 standardized bank-ready financial indicators
Expected Net Yield
Median Base-Case
The most likely cash-flow outcome. 50% probability that the actual revenue will exceed this level, and 50% that it will fall below it.
Bankable Income
90% Confidence Level
The conservative scenario required by financing banks. 90% statistical probability that revenue will meet or exceed this target.
Earnings-at-Risk
Cash-Flow Safety Net
Measures the maximum expected revenue shortfall over a given period compared to the base case, calculated with a 95% confidence level.
Value-at-Risk
Portfolio Risk Exposure
Evaluates the maximum potential decrease in open-position asset value (NPV). Crucial for optimization of long-term corporate PPAs.
1. Financial Overview & Expected Revenues
2. Risk Profile
Net Cash-Flow Distribution (Billable)
Billable/forecasted quarter-hourly DA prices and negative pricesCumulative Revenue Probability (S-Curve)
EaR range and cumulative distribution mappingSolving the Financing Gap
Tailored risk analysis for every stakeholder in the solar ecosystem
Core Market Solutions
Investors & M&A
Perform robust Go/No-go due diligence validations on operational assets and new development portfolios using independent capture price projections.
Financing Banks
Avoid the standard 30-40% blind safety haircuts applied during credit approvals. Prove exact debt service capabilities (DSCR) with algorithmic confidence limits.
Asset Owners
Optimize your spot exposure and design optimal hedging overlays (PPA vs. Merchant mix). Calculate forward cash projections for 24+ months with exact contract metrics.
Algorithmic Ecosystem Map
Corporate PPA Buyers
Earnings-at-Risk (EaR) quantifies the budget reserve needed to cover electricity shortfalls from the spot market when solar generation is low.
Insurance Companies
Accurately price revenue guarantees and weather derivatives using thousands of Monte Carlo simulation runs.
Risk Teams at Aggregators
Run pre-expansion portfolio checks to quantify how adding a new PV asset impacts the imbalance Value-at-Risk (VaR) of the existing portfolio.
Quantitative Traders
Model price dips and merit-order effects caused by solar penetration for high-yield power futures speculation.